Critical Data Overload: Restitutions
Plan for the day
This morning:
- cleaning and formatting data
- modes of representation
- work session
This afternoon:
- work session
- presentation of corpus
Cleaning and formatting data
Cleaning data and formatting data is essential for sustainability.
Cleaning involves:
- removing duplicates
- removing incomplete
- removing extra whitespace
- force datatypes
- standardize formats
Formatting involves:
- choosing a storage format (CSV, JSON, XML)
- consolidating into one file if possible
- naming files properly (e.g.
YYYY-MM-DD_HH-MM-SS_{name-of-data}_{random-number}.{format}) (avoids overwrites! helps finding data!)
CSV (comma-separated value) is the file format of Excel, very popular, not very expressive
name,location,date
'paris,texas',us,1984
ikiru,jp,1952
mauvais sang,fr,1986
parasite,kr,2019
import csv
films = [
{
'name': 'paris, texas',
'location': 'us',
'date': 1984
},
{
'name': 'ikiru',
'location': 'jp',
'date': 1952
},
{
'name': 'mauvais sang',
'location': 'fr',
'date': 1986
},
{
'name': 'parasite',
'location': 'kr',
'date': 2019
},
]
with open('data.csv', 'w', newline='') as csvfile:
fieldnames = ['name', 'location', 'date']
writer = csv.DictWriter(films, fieldnames=fieldnames)
writer.writeheader()
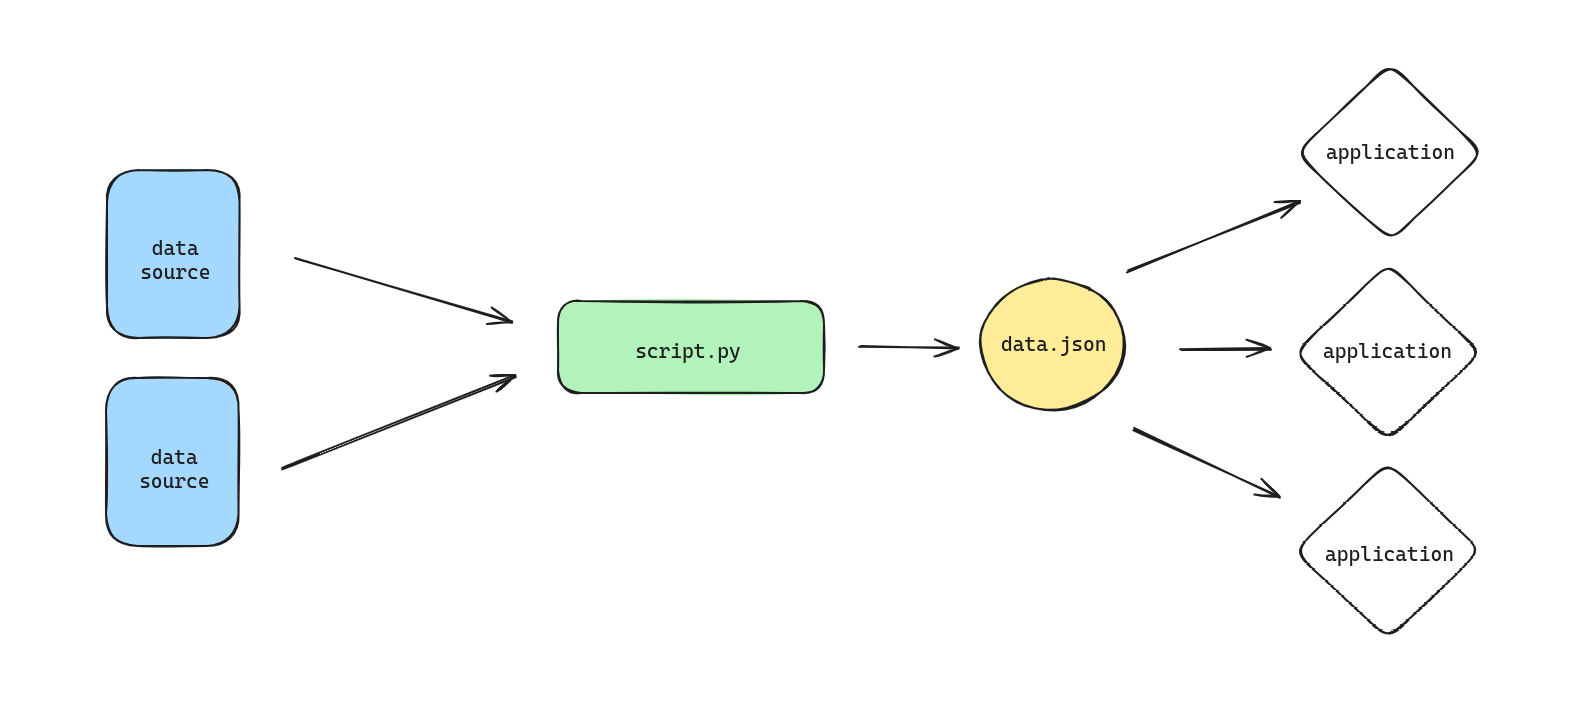
writer.writerows(data)JSON is more expressive than CSV, but a bit more complicated
import json

data = {
    #...
}

with open('data.json', 'w') as jsonfile:
    json.dump(data, jsonfile)
Modes of representation
We have data. Now what?
Representation shapes data to express something.
- What do we want to say?
- How do we say it best?
- What kind media? What kind of context?
Transmedia to reveal patterns in an engaging way.
- sound, space: Two Trains
- sound, space, time: airpressure
Zoomed out to reveal the sheer size of smaller, repeating elements
- on a plane ( hhellbbllaauu )
- in a space ( embedding projector )
- on a track ( quotidian record )
Zoomed in to focus on each piece of data, with the quantity as a background
- on a plane ( wonders of street view , mturk poems )
- in space ( astronaut.io )
Focusing on the mass or on the sample?
Giving a lot of context, a little context, or a whole new context?
Is it more of a document, or a performance?
Is it a restitution, or an interpretation?
Work session
- finish gathering your data
- finish cleaning your data
- write some notes about what you did, how you did it, and why
- think about some ideas for representing the data
Presentations
- Helin is joining ✨
- For each group, connect to Zoom and share screen (link in Discord)
Questions:
- What data did you gather? Why?
- How did the gathering go? What did you use and what were some obstacles?
- How do you imagine using this data afterwards?